Snooker: A global culture that remains too UK-centric
Although the British billiard game snooker has become a global culture and entertainment industry, it has been argued with some regularity that its prize money distribution is questionable and that the professional tour is still too UK-centric. In fact, there have only been five world champions from outside the UK in the more than 50 years of the game’s modern era.
“Prize money distribution is a subject of much discussion among players, many of whom are unhappy with the present arrangements”, according to snooker commentator David Hendon. Indeed, triple-crown winner Sean Murphy recently stated that “the way the game is funded [...] it can never be truly independent of the people it’s trying to negotiate with and make the game better for the players.” Similarly, former World Snooker Tour photographer Monique Limbos complains about “the UK-centric nature of the organisation of the sport”.
However, most of these arguments contain little quantitative analysis other than an occasional simple statistic. One could even ask whether it is possible to quantify such an issue at all. A basic mathematical analysis suggests a positive answer to this question, and provides statistical evidence that supports the original claims.
Snooker statistics
The website CueTracker provides a wealth of snooker statistics, including seasonal prize money rankings. From these rankings it can be calculated what percentage of the players is from the UK, and the share of the available prize money they earned. The image below shows the results of these calculations for 45 seasons, from the 1980-81 season to the 2024-25 season. The dark blue line represents the percentage of UK players in the prize money ranking in a given season. The light blue line represents the share of the total amount of prize money in a given season that was earned by these UK players together.
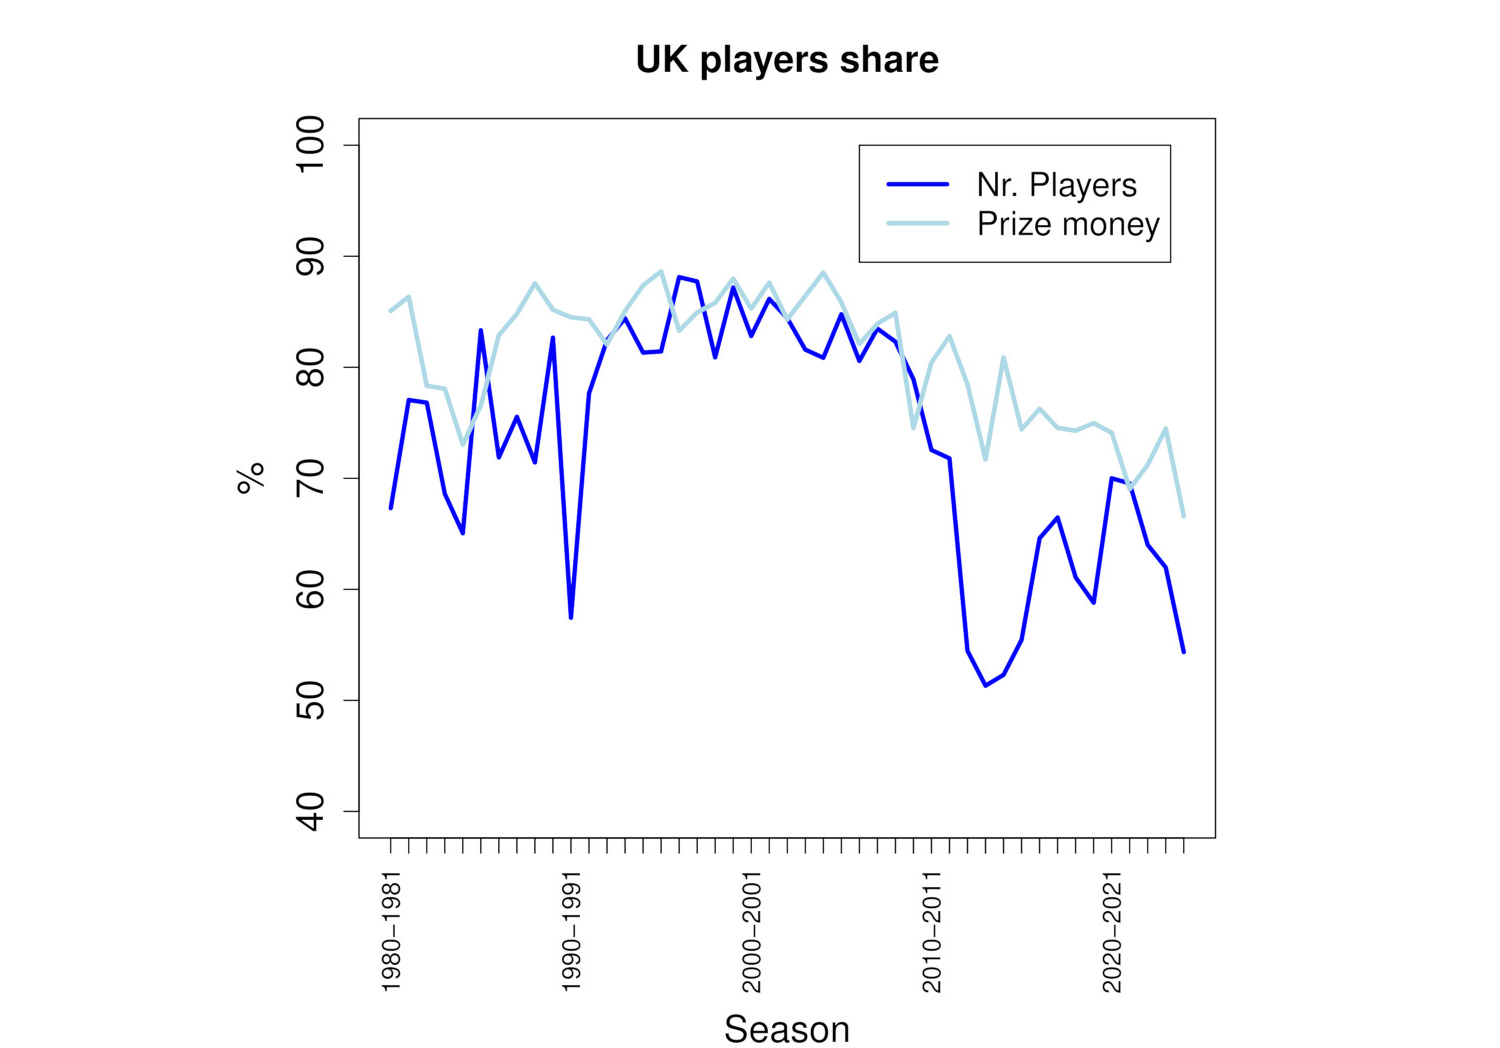
It is immediately obvious from this image that the light blue line is above the dark blue line for the majority of seasons. Only in the middle range are the two lines at a roughly similar level, with the dark blue line only occasionally being above the light blue one. What this indicates, is that the share of prize money earned by players from the UK is generally larger than the actual percentage of UK players.
However, the question remains how significant this is. Could this be just by chance? Could it be a random fluctuation that happens to be in favour of UK players, but is otherwise within the range of statistical expectations? The answer to this question can actually be calculated mathematically. To understand the general idea behind this calculation, without the mathematical details, consider the distribution of human heights.
Human height distribution
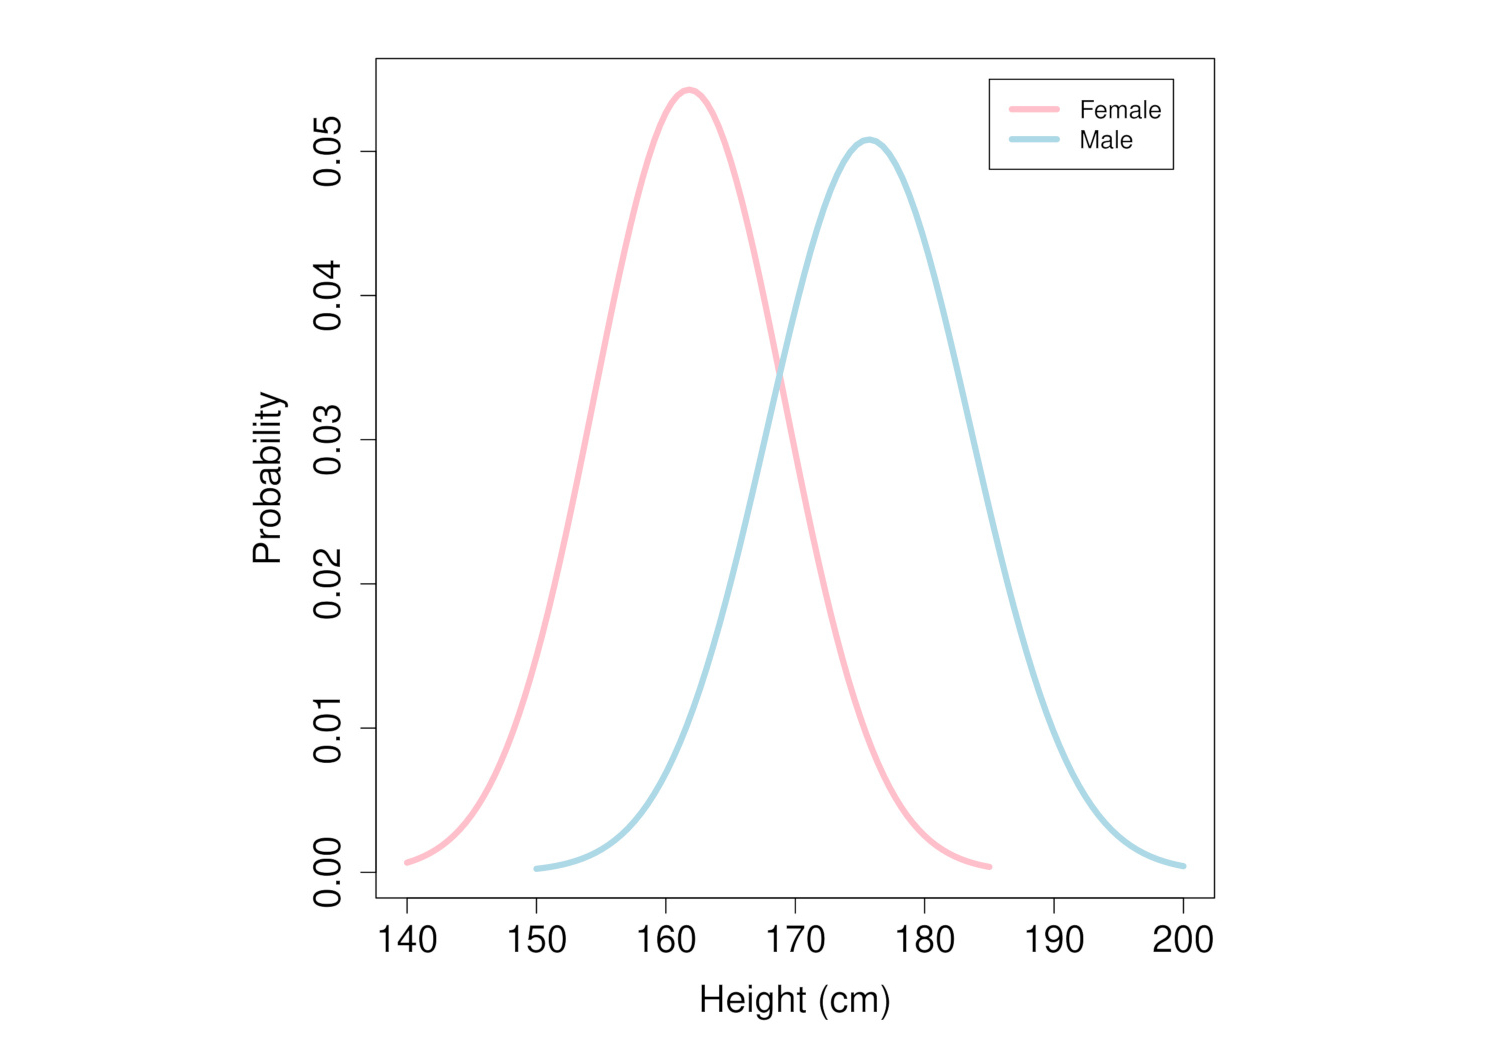
According to data from the US National Center for Health Statistics, the average height of US females aged 20 years and over is 161.8cm. The average height of US males aged 20 and over is 175.7cm. Of course there is a certain amount of variation around these averages, but this turns out to be very similar in both cases.
If nothing was known about the actual distribution of human heights, though, the most basic assumption one could make is simply that there is no difference in average height between females and males. In other words, if two random samples were taken, one for females and one for males, the expectation would be that the averages of the heights within each of these two samples will be roughly equal. The more these two observed averages differ, the more surprising it would be under this basic assumption.
However, the amount of surprise also depends on the sample size. For example, if the sample size is only two and the average height of the two sampled females is about 10cm less than that of the two sampled males, it would not be too surprising, even under the basic assumption. In fact, it can be calculated mathematically that the probability of finding at least a 10cm difference in average height, assuming the two samples came from the same distribution, is around 0.1. Observing something that has a one in ten chance of occurring is nothing to be surprised about, and certainly provides no reason to doubt the basic assumption.
In contrast, with a sample size of ten this probability already changes drastically. In this case, the probability of observing at least a 10cm difference (again assuming there is no real difference in average height) becomes only 0.002, or two in a thousand. Such an observation would be quite surprising, and definitely cast doubt on the basic underlying assumption.
In fact, statistically speaking such a low probability makes the observed difference in sample averages significant enough to reject the basic assumption. In other words, the observed difference cannot be considered a random fluctuation, and suggests the alternative assumption that the two samples actually came from different distributions. Indeed, there is a real and statistically significant difference in the height distributions of females and males, with females being on average about 14cm shorter than males.
UK players share
Returning now to the original snooker statistics, the average percentage of UK players among all prize money winners, as measured over the 45 seasons considered here, is equal to 73%. However, the average share of the prize money earned by these UK players is 81%, a difference of eight percentage points. A similar calculation as done with the human heights example above results in a probability of less than 0.0001 of observing at least such a difference in averages, again under the assumption that both samples came from the same distribution.
So, with a probability of less than one in ten thousand, it is clear that this basic assumption should be rejected. In other words, there is a real and significant difference between the underlying distributions of these two samples. If all conditions were equal for both UK and non-UK players, one would not expect the average share of prize money earned by UK players to be significantly different from the average percentage of UK players, especially with a sample size of 45. However, the observed difference is statistically highly significant, suggesting there really is an advantage for UK players.

The mathematical details of this analysis of prize money distributions in snooker were presented in a scientific article published in the Journal of Applied Econometrics and Statistics. Hopefully these results will provide a more quantitative basis for any further discussions about whether the snooker tour is too UK-centric. As the illustrious scientist J.B.S. Haldane once said: “An ounce of algebra is worth a ton of verbal argument.”
The world championship snooker has been held in the same place (Sheffield, UK) since 1977. Is it time to have it live up to its name and be held in a different country across the world each year? Perhaps this will help level the green baize a bit more, rather than it being (statistically) slanted in favour of players from the UK.
Wim Hordijk, Ph.D., is an independent scientist and writer, and a long-time snooker fan. More information about his research and publications can be found on his personal website.
Tekst & illustraties: Wim Hordijk